日志
从地心说看中西科学的差距
热度 4 ||
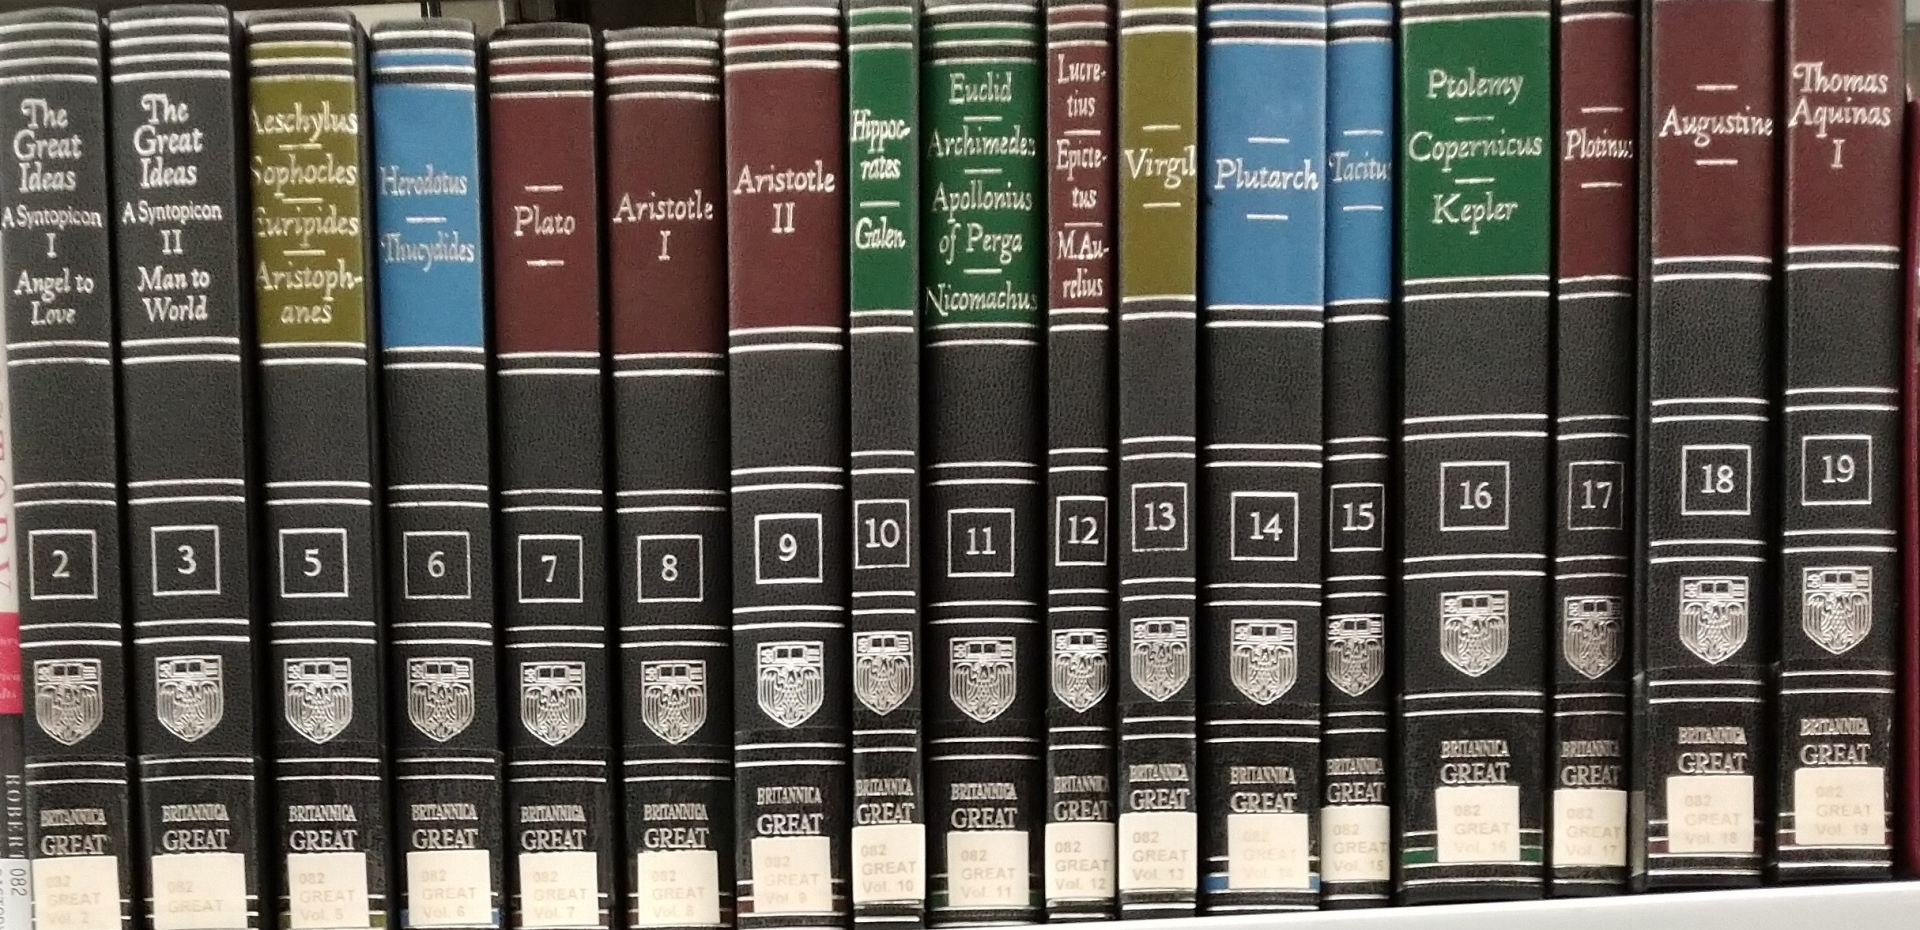
前些天偶尔在社区图书馆逛逛,在书架上看到一套丛书《西方的伟大著作》。其中一本《Ptolemy, Copernicus, Kepler》(托勒密,哥白尼、开普勒)立刻引起了我的强烈兴趣。哥白尼几乎公认是日心说--地球绕太阳转--的提出者。开普勒中学物理课本里讲到过他的行星运动三大定律。其第一条说,行星绕太阳以椭圆轨道运行,太阳在椭圆的焦点。第二条说,行星与太阳连线相同时间扫过的面积相同。第三条,我就不复述了。牛顿正是从开普勒定律得出了万引有力的平方反比律。但从中学开始,我对开普勒三定律带着一种更深的莫名的神奇感:他是如何总结出那三条定律呢?须知,在地球上看行星,能够测量的也就是行星相对于星空的位置(或者说角度)而不知道距离,何况地球不但在自转还在绕太阳公转。这太不可思议。有一个说法认为开普勒是人类历史上最聪明的人之一,我完全赞同。托勒密呢?我也读过一些零星的描述,知道他的理论是太阳、行星都绕地球做圆周运动,对于不能跟观测吻合的情况,他就在大圆上加个小圆,甚至还有人(传讹)说他在小圆上再加小圆。各种当代著作里对托勒密的学说近乎嘲讽。哥白尼我曾经在科普文中写到过,从间接的资料知道他的日心说当时不被接受并非由于教廷反对,而是因为其精度不如托勒密的理论。但我从未读过这三人自己的著作。现在机会来了。
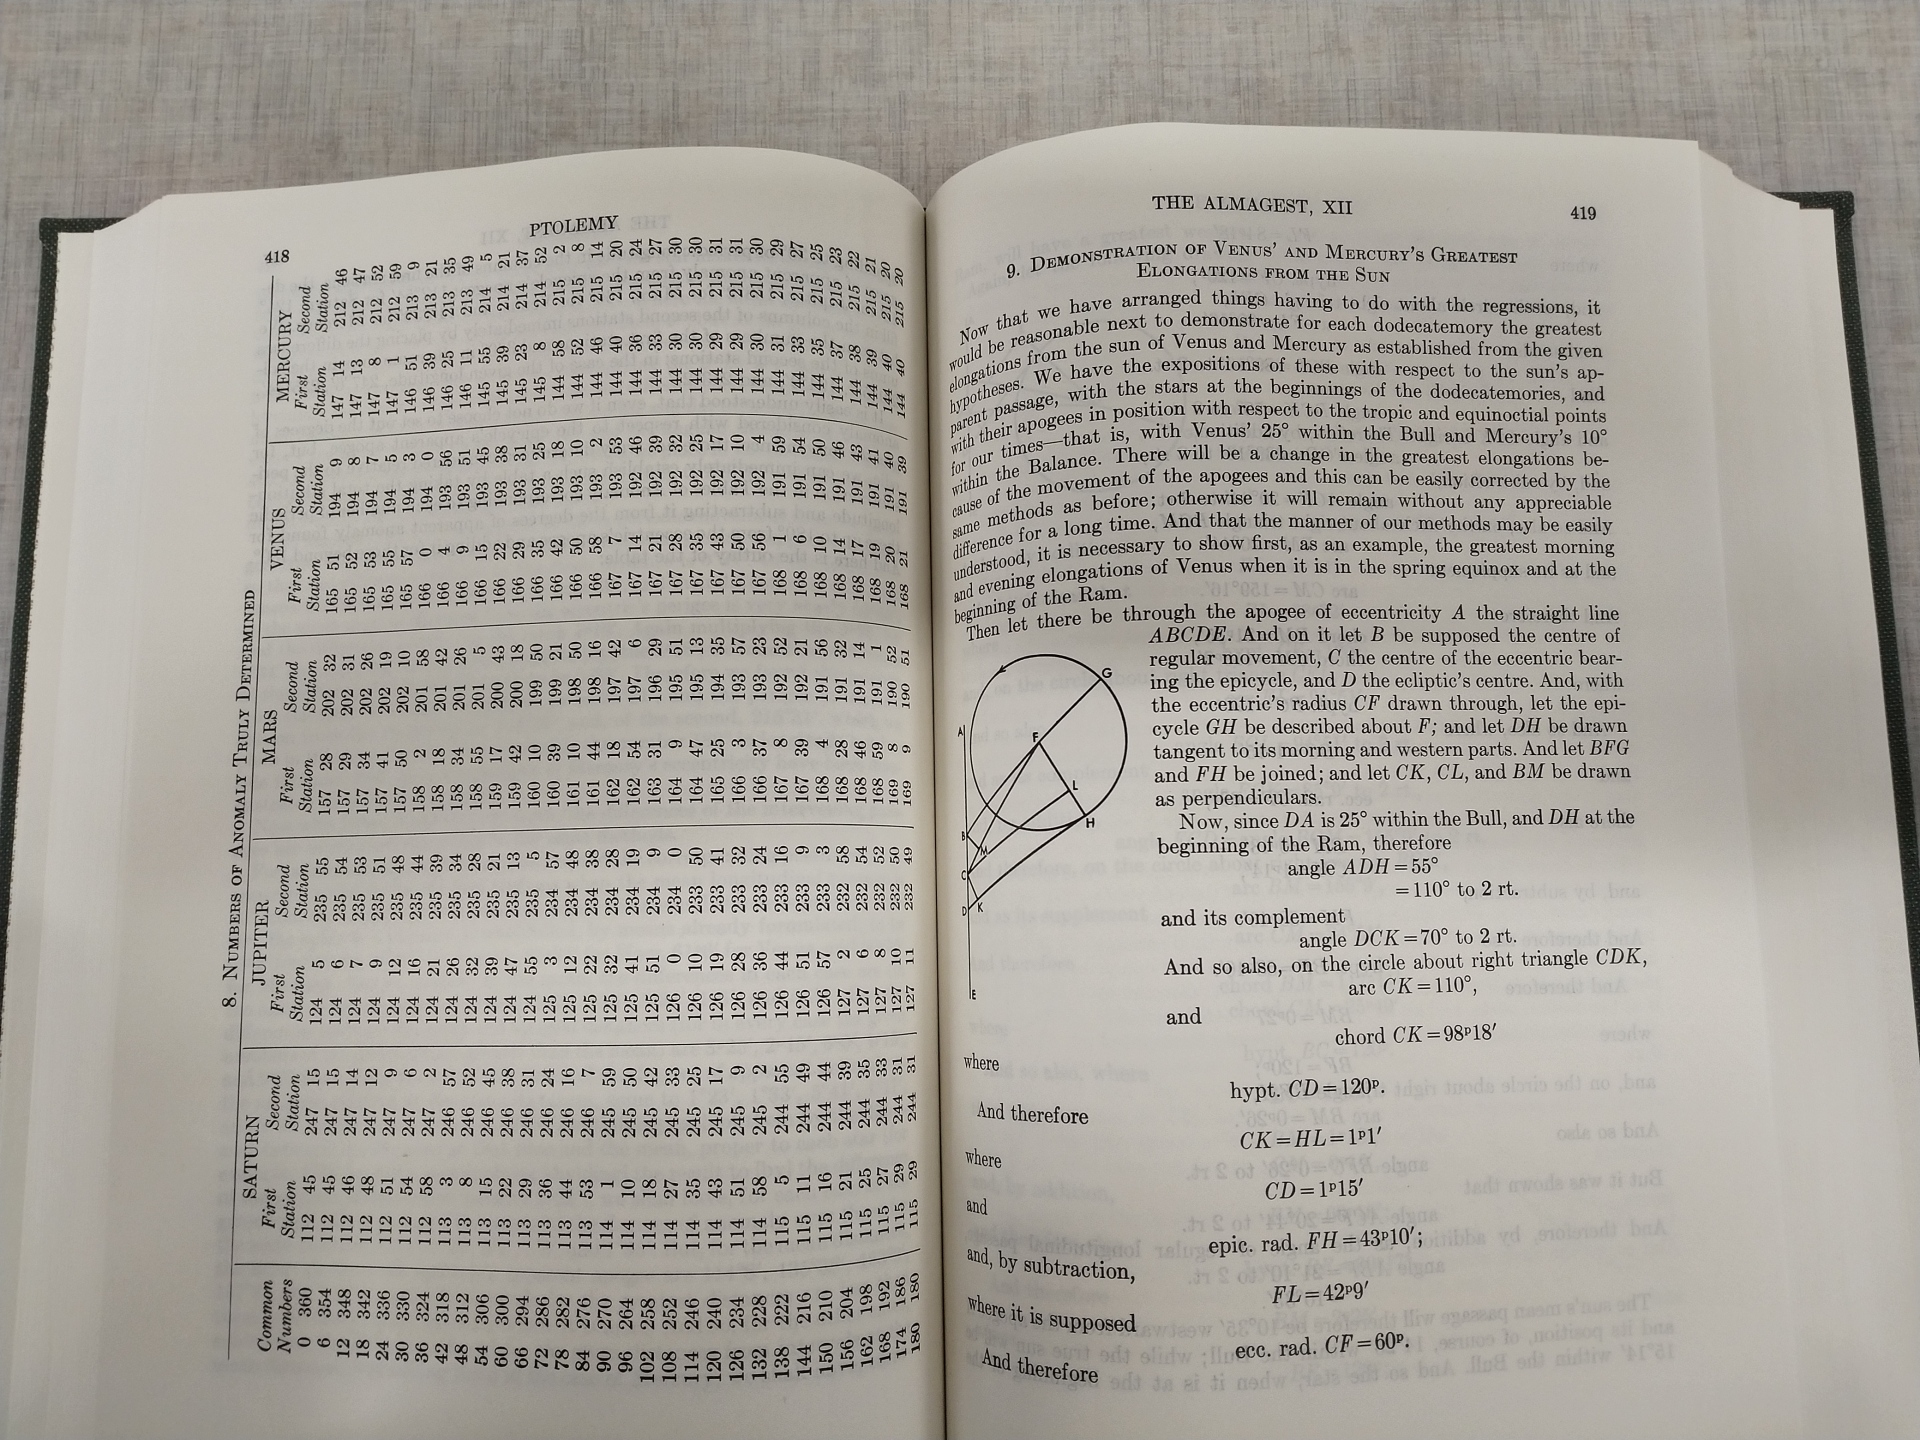
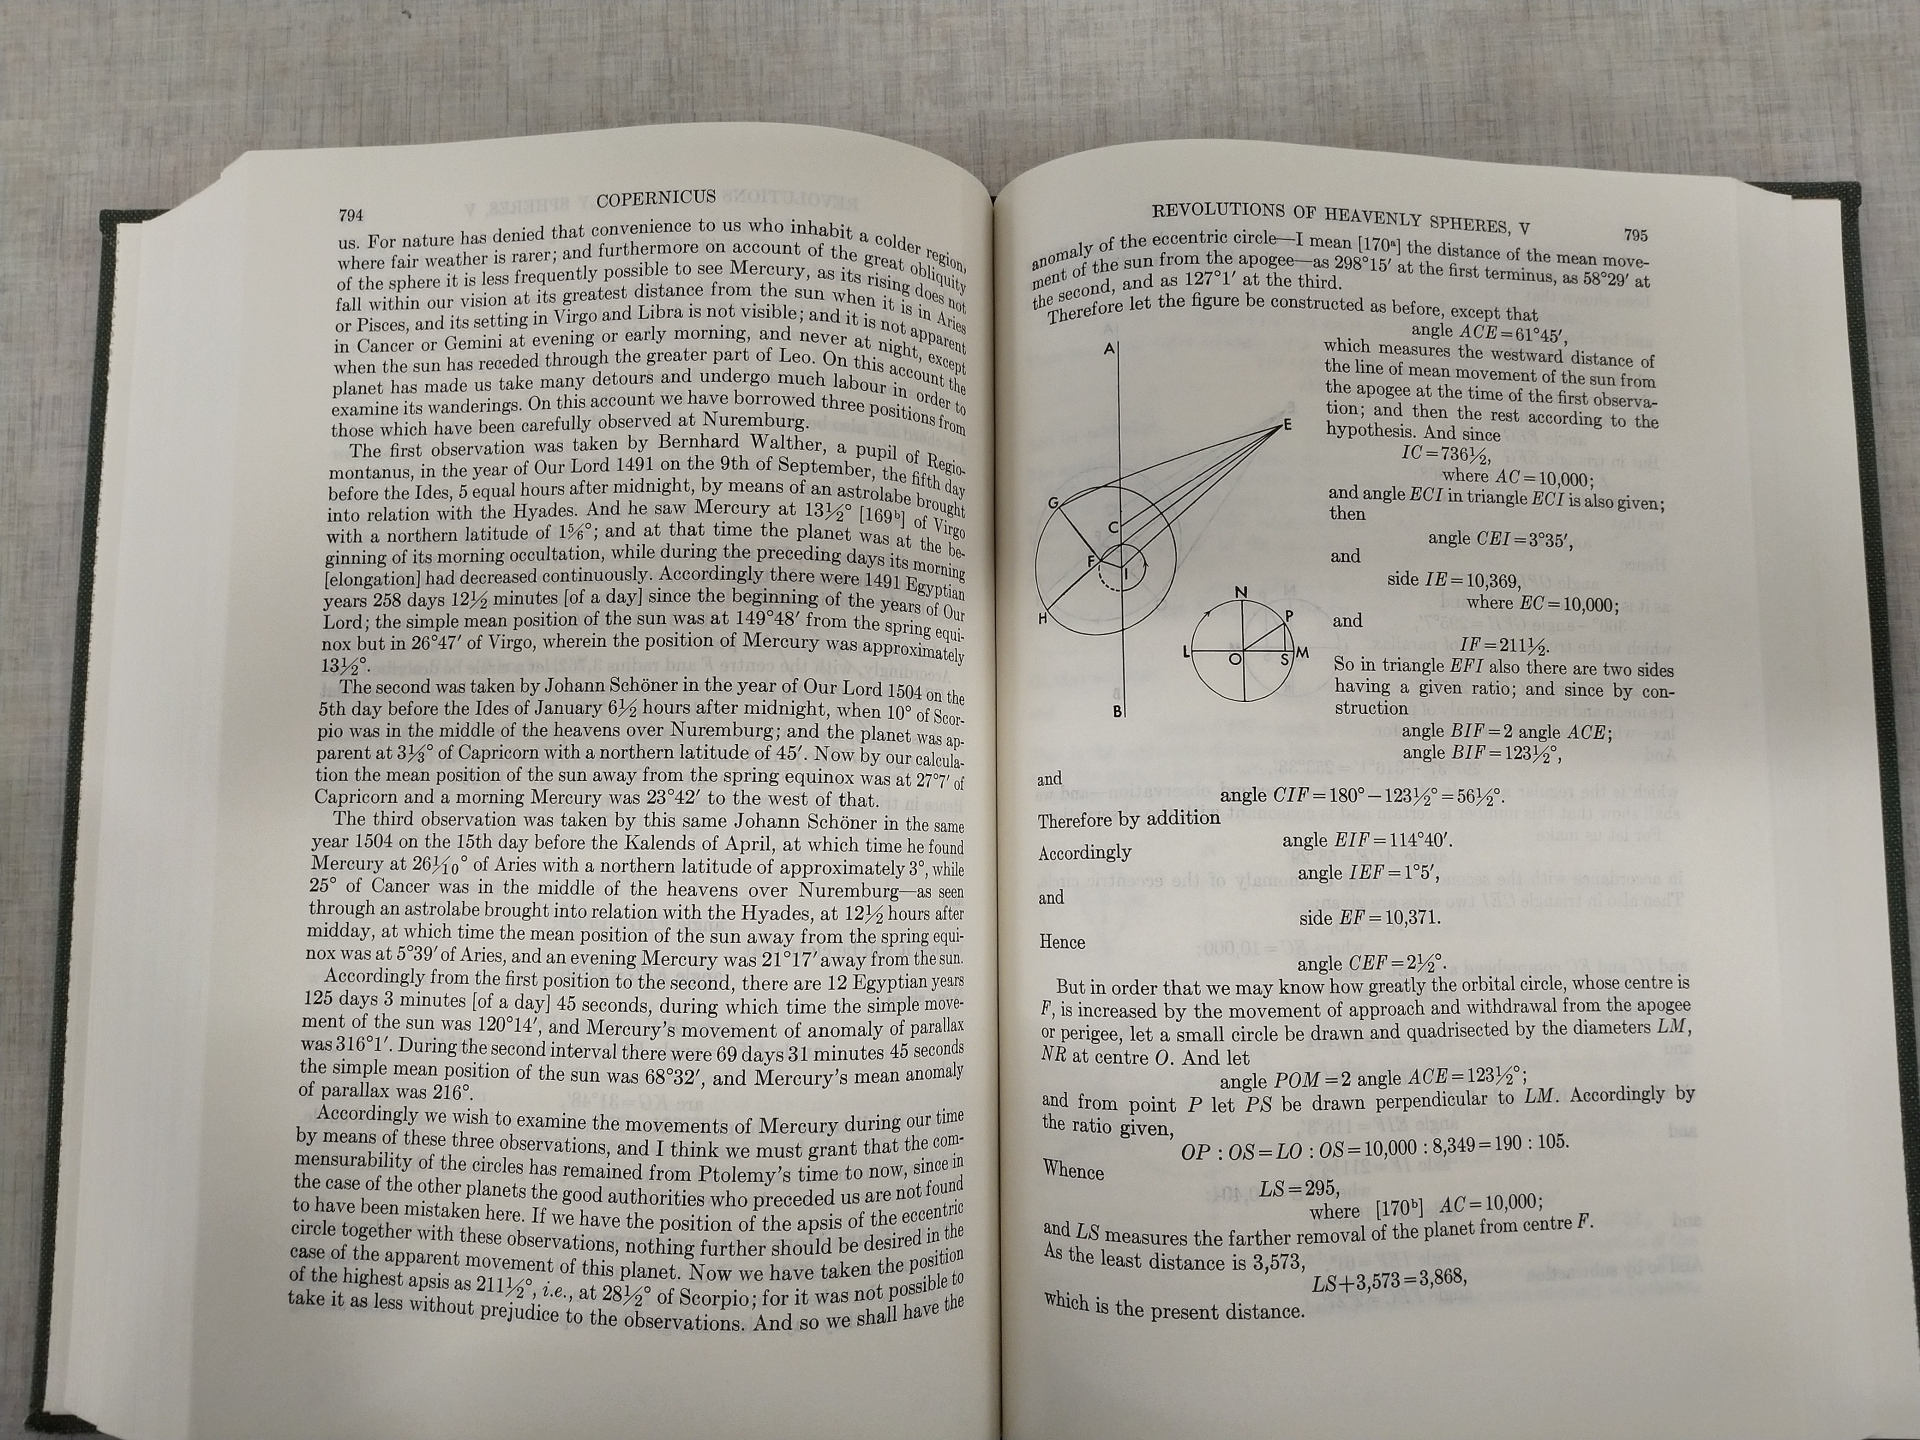
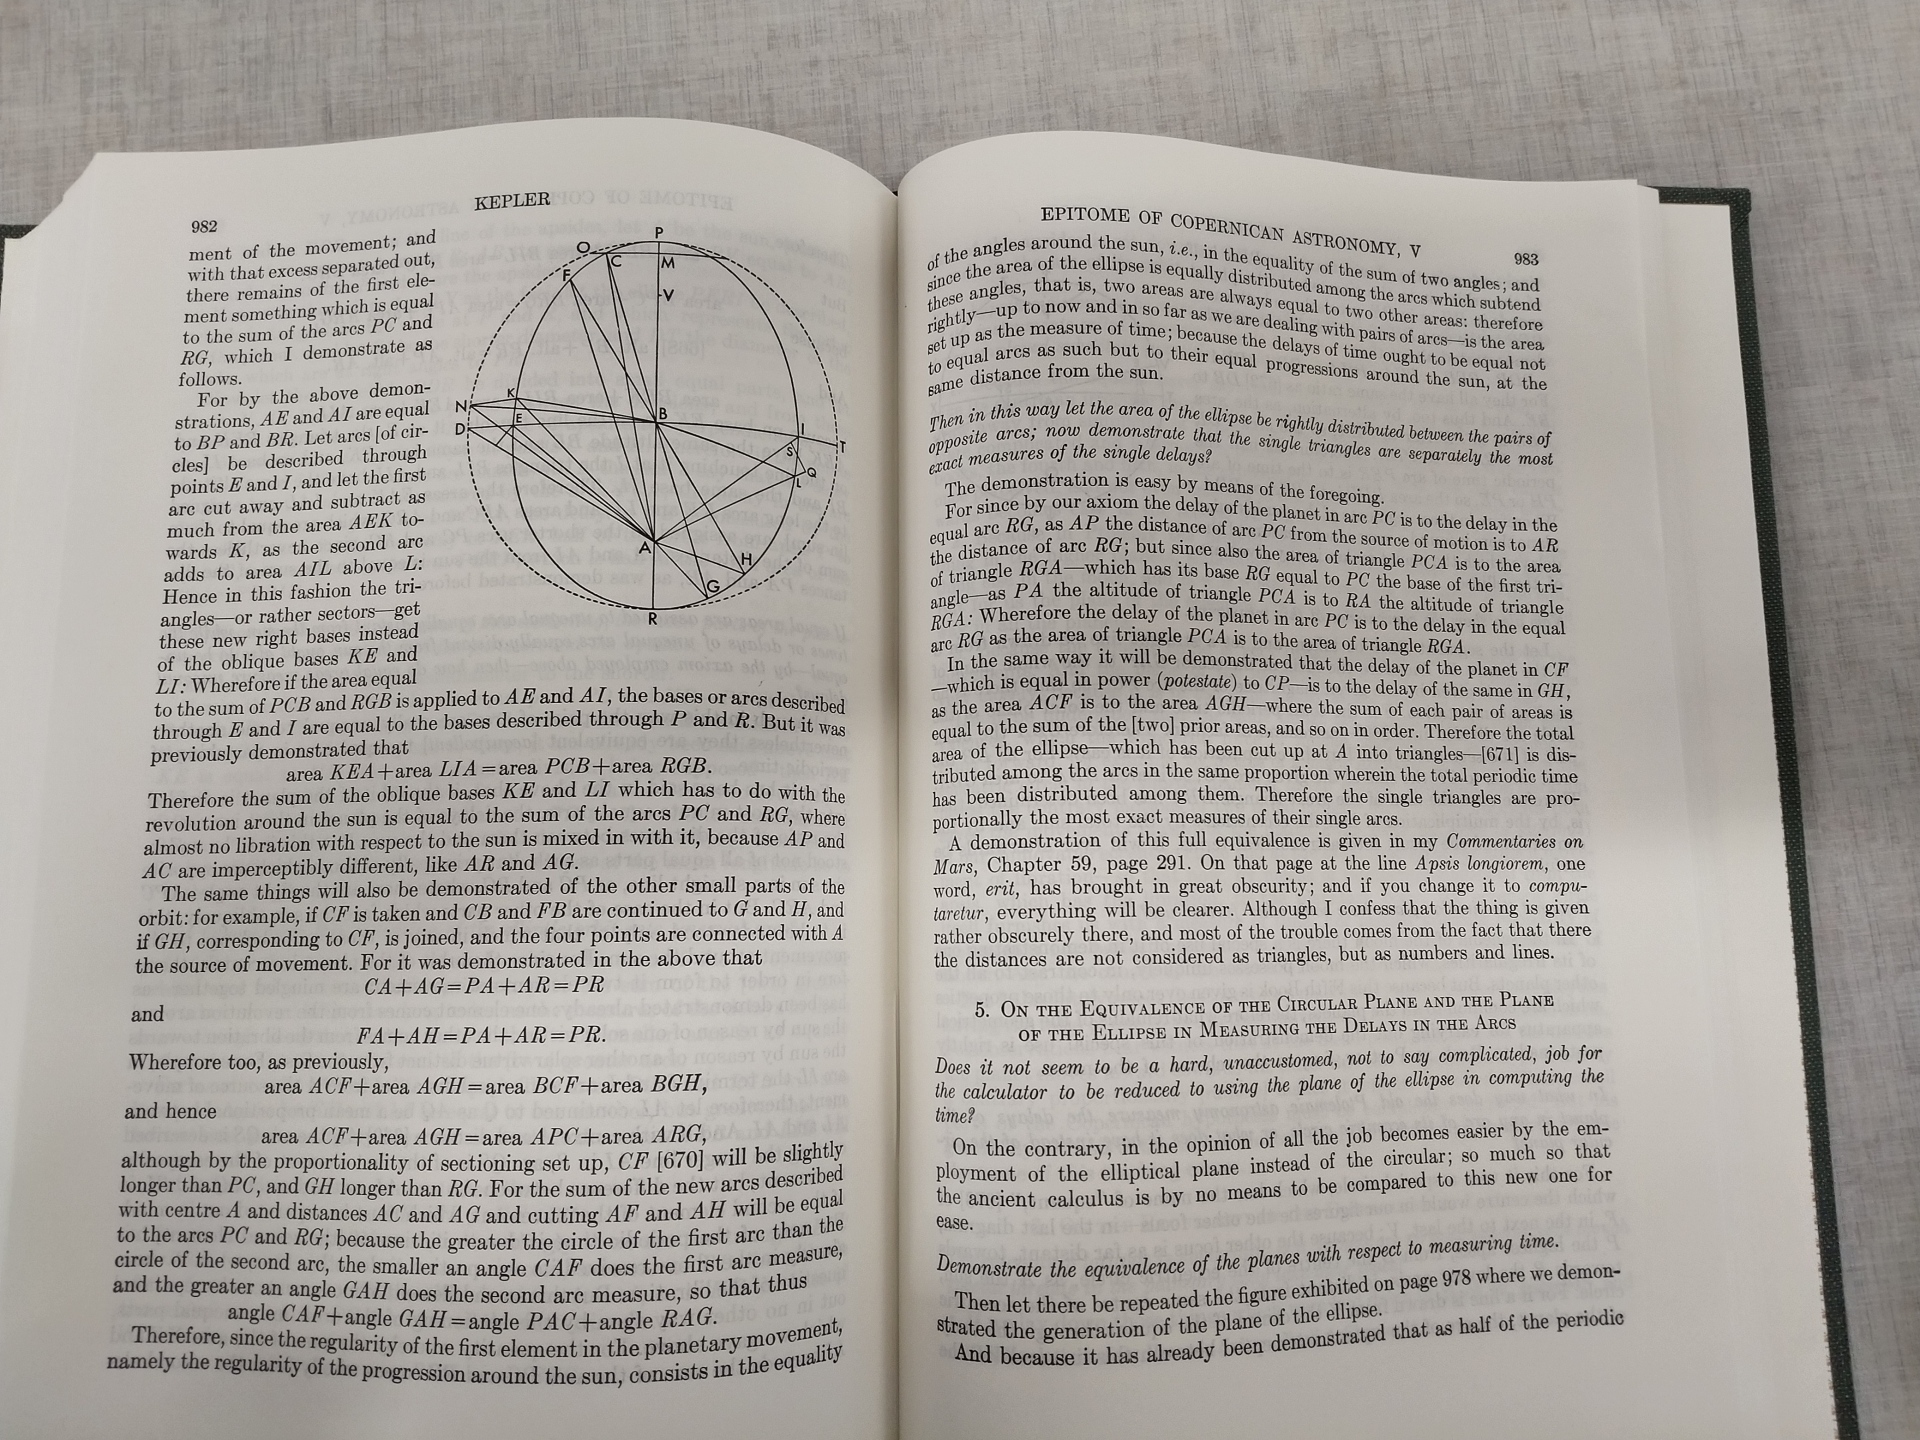
坐下打开书一看,发现托勒密、哥白尼与开普勒三人的著作都是高度数学化的。托勒密的书叫《ALMAGEST》,意思就是《专著》(原希腊文书名是《数学化专著》(Mathēmatikē Syntaxis))。这本书有好几百页,详细列出了各种几何 图形,各种证明、计算,各种数据。光凭这一点,我对托勒密的看法已经发生了不小的转变。因为这已经完全具备了科学的特征。数学化的天文理论是具备可证伪性的硬道理。是对是错,托勒密给你一个计算方法还有具体的例子,你不信可以自己去算并且跟实际情况比对。哥白尼的书跟托勒密著作非常相似,充斥 各着种几何证明与计算,从其插图就知道太阳在中间。但这些古书对于现代人来说过于繁琐,一时无法看明白。这主要是因为他们使用的数学工具过于简陋,基本只是欧几里得几何,现在看来应该非常直接的计算在书中却非常繁琐,各种古代天文术语更令人费解。我匆匆翻看了一阵,用手机拍了几张照片(见文末附图1)就走了。至少我已经知道,托勒密学说绝不是空穴来风似的哲学虚词,而是数学化的硬科学。那么托勒密学说到底是怎么回事?与其试图去读那么厚的书,我们不妨按照现代人已经知道的知识去重构其“地心说”理论。
首先,太阳绕地球转有错吗?当然没有!当一个人以自我为中心,整个世界都在围着他转。如果从太阳看地球绕太阳转,那么从地球看,太阳就是在绕地球转。这既是我们的实际体会,也是简单的参照坐标变换。地球 E 到太阳 S 为 ES,那么太阳到地球是 SE = -ES (忽略向量符号)。 ES转圆圈,-ES 当然也是转圆圈,而且转的方向相同。那么行星呢?太阳S 到行星P为 SP,太阳到地球为 ES,那么地球E到行星P就是 EP = SP - SE。换言之,从地球上看,行星的轨道就是行星绕太阳的轨道减去地球绕太阳的轨道。如此看来,托勒密的大圆应该就是行星绕太阳的轨道,而小圆就是地球绕太阳的轨道(但有一个180度的相差)!太阳绕地球是圆,行星绕地球又是怎样的呢?为此,我写了一个程序查看。左边的图是“日心”图,暂不考虑行星轨道严格是椭圆,而是用圆代替,黄色是太阳,紫色是金星,绿色是地球,红色是火星,周期根据实际轨道比例。右边是“地心”图: 从地球看太阳、行星,其计算只是将左图中星体轨道减去地球的轨道向量(上面提到小圆,这只是为了少用术语,当然对于金星来说,小圆-地球轨道更大)。结果发现,从地球上方看,行星的轨道如同天上的莲花:
仔细观察上面右图,我们发现从地球上方看,行星会发生中途逆行的现象,本来是是逆时针转,但在那个螺线形状的附近,会发生短暂的转向,再恢复原方向。古代希腊人观测到这个 retrograde 现象,因为用简单的圆周运动无法解释,于是在圆上加了一个小圆,当行星在小圆上正好转到地球上方,方向就倒了。按照上面的重构模型,行星绕地轨道等于行星绕太阳轨道(大圆)减去地球绕太阳轨道(小圆),那么依照托勒密理论进行计算,所有行星的小圆都应该是跟地球一样一年转一圈,而且相位相同。托勒密难道没有察觉到这一点惊人的巧合并且做出更多的思考吗?我继续查阅资料,发现这一点就是哥白尼的伟大发现,托勒密确实没有意识到内中的奥秘。在托勒密模型里,不同行星轨道的小圆大小不同,但是周期相同,而且小圆中心到行星的连线总是平行于地球到太阳的连线。哥白尼正是从这一点所谓巧合找出了本质原因而创立了他的日心理论。日心说并不是哥白尼的发明,古希腊早有人认为行星绕太阳转了。但是没有数学预测能力的说法只是空谈。哥白尼从托勒密模型结果中看似的巧合建立了完整的日心理论。也就是说,托勒密的地心理论是 EX = SX - SE(也是就是上面复杂的右图)。哥白尼以太阳为中心,直接就是 SX(左图)。在托勒密模型中,无法确定小圆的半径,而只能确定行星轨道大圆与小圆的半径比例。哥白尼理论中,托勒密的小圆就是地球轨道,那么大圆(也就是行星轨道)相对于地球轨道的大小也就定下来了。这可以说是哥白尼的主要贡献。
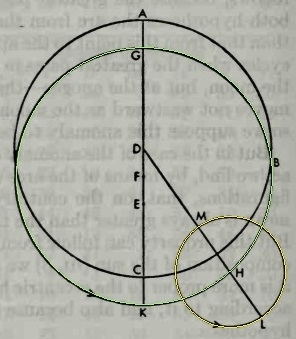
托勒密的行星轨道理论却远不是圆圈上加圆圈这么简单。所谓地心说里,地球并不是在正中心。托勒密的著作中前两章提到,行星绕地球轨道是大圆加小圆是前人的成果,而且地球并不是处于大圆的圆心,而是偏离一个距离。托勒密称之为偏心圆。在托勒密前人的理论中,行星是在这个偏心圆上绕圆心匀速运动。但托勒密发现这样的模型跟观测数据仍然存在一定差异,于是他进行了一个大胆创新。托勒密提出,行星是在偏心圆上运动,但绕圆心另一侧的一个等距点匀速转动。这一点称为“均点”(Equant)。中国明代翻译托勒密模型中的大圆为“均轮”可 能就是因为这个原因。下面是托勒密书中的插图。我加上了颜色。绿色(GHK)是行星轨道的大圆,F点是这个轨道的圆心,地球在偏心点位置 E,而D点则是均点,黄色是轨道的附加小圆。托勒密前人的理论里,在大圆上是绕大圆圆心F 匀速转动。而在托勒密理论里,转速相对于D点才是匀速。
我们现在知道,行星绕太阳的轨道是椭圆,太阳在椭圆的焦点。稍加计算发现,对于偏心率不大的椭圆,其短轴与长轴的差别正比于偏心率的平方。短轴与长轴的比是 $\sqrt{1-e^2} \approx 1- e^2/2$。如果椭圆偏心率为10%,虽然焦点偏离中心的距离是半径的10%,短轴与长轴的差别却只有 0.5%。即使偏心率为20%,长短轴的差别也只有约2%。太阳系里偏心率最大的是水星,约 21%。所以,平移的圆形是椭圆的高度近似。在下面,我用个图进行说明。下图绿色是原点(蓝色)为焦点, e =20%的椭圆,蓝色是以原点为圆心的圆。红色虚线是把蓝色的圆平移一个焦距(0.2),这个红色虚线圆的圆心是 D。从图中可以看出,红色虚线几乎与绿色的椭圆重合。因此,偏心的圆是 e = 20% 的椭圆的良好近似。太阳系中另一个轨道偏心率较大的是火星,偏心率为 9.3%,其到太阳的距离在近日点与远日点相差 20%,但其轨道的形状与圆形相差非常之小,在类似的图中几乎完全看不出差异。
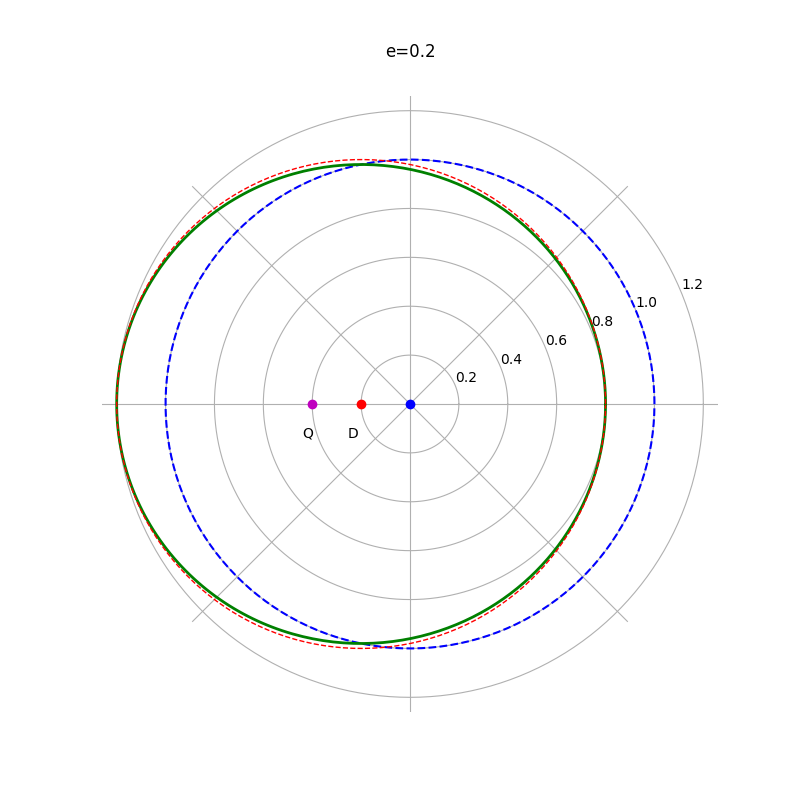
在托勒密理论中,地球位于上图的原点(蓝色),行星轨道的大圆是上图的红色虚线。但大圆上的运动不是绕其圆心D匀速,而是绕“均点” Q匀速运动。(这里跟托勒密书中用的符号不同)
根据开普勒第二定律,行星轨道为椭圆,太阳位于椭圆的焦点,而行星到太阳连线在相同时间内扫过的面积相等。用下面的图解释。椭圆的中心在O,太阳在椭圆的焦点 B,行星C在椭圆轨道上,且 BC 单位时间扫过的面积相等,但因为 BC 长度是变化的,其角速度也变化。而在托勒密理论里,CA 连线为匀速转动。托勒密理论与开普勒理论相比差多少呢?为此,我使用开普勒轨道,并计算 AC 转动的角速度,看它与匀速相差多少。
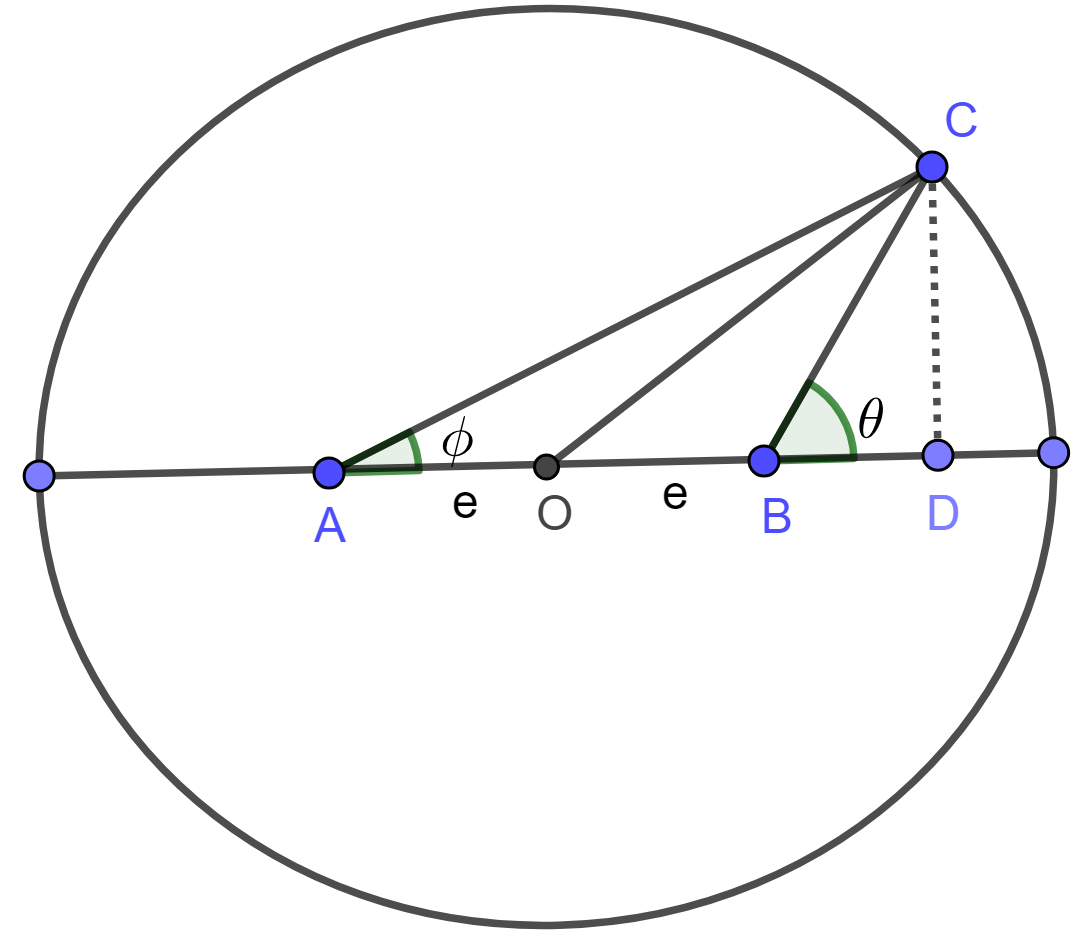
考虑椭圆上C点的速度,因为AC+BC长度不变,以A为中心的径向速度与B为中心的径向速度大小相同,符号相反,因此椭圆上C点以A为中心的切向速度等于以B为中心的切向速度。切向速度等于距离乘以角速度,因此
$AC \ \dot\phi = BC \ \dot\theta$
因此,C点绕B点的角速度与C点绕A点的角速度的关系为
$\dot\theta = \frac{AC}{BC}\dot\phi$
C点绕B点单位时间扫过的面积为
$\dot{s} = \frac{1}{2} (BC) ^2 \dot\theta = \frac{1}{2} AC \cdot BC \ \dot\phi$
根据余弦定理以及椭圆 AC + BC =2 的属性,
$BC^2 = (2-AC)^2 = AC^2 + (2e)^2 - 2 \times 2 \ e \times AC \cos\phi$
因此,
$AC = \frac{1-e^2}{1-e\cos\phi}, \ BC =\frac{1-e^2}{1+e\cos\theta}$
因此 CB 单位时间扫过面积为:
$\dot{s} = \frac{\dot\phi}{2} \frac{(1-e^2)^2}{(1-e\cos\phi)(1+e\cos\theta)}$
从上图以及 cos 的定义可见,
$\cos\phi = \frac{BD+2e}{AC} = \frac{BC \cos\theta+2e}{ 2- BC }$
当 e 远小于1的时候,AC,BC都近似为1,因此,$\cos\theta-\cos\phi \approx -2e$
详细代入 BC 的极坐标公式到$ \dot{s} $ 的公式,并在 e =0 展开,我们惊奇地发现
$\dot{s} = \frac{\dot\phi}{2} [1- \cos^2\theta\ e^2 - 2\cos\theta \sin^2\theta \ e^3 + O(e^4)]$
也就是说,开普勒轨道绕托勒密的 EQUANT 点的角速度与常速的差别是 e 的二阶小量。如果 e=10%,这个角速度与常速差别小于百分之一。如果 e =0.21, 差别也就是 4% 量级。而且这个角速度误差导致的角度误差不是累积的,而是周期性抵消。简单积分的结果,托勒密轨道的角度误差随角度的变化为 $\frac{e^2}{4}\sin(2\theta)$。对于火星来说, e=0.093, 托勒密轨道与开普勒轨道的最大角度误差只有约 0.093^2/4 * 180/3.14 = 0.12 (度)。
上面的推导可能不太直观。为此,我用 PYTHON 编写了一个程序绘制两个轨道图(代码附二)。图中黄色圆为太阳。红线为开普勒轨道,使用4阶 Runge-Kutta 数值方法进行计算。另一条蓝线则是 托勒密轨道(也就是偏心圆轨,绕均点匀速转动)。并且画出角度差异。分别对偏心率 9.3%( 火星)与偏心率21%计算。有兴趣的读者可以查验运行代码。结果如下:
上面的图显示,火星轨道用托勒密与开普勒的理论分别计算,红(开普勒)蓝色(托勒密)几乎重合,差别几乎无法判断。即使对水星而言,红蓝两线也接近吻合。可见,托勒密理论与开普勒理论相差甚小,运用于太阳系已经相当准确。哥白尼虽然把托勒密的理论修改成了绕太阳转,但是在处理转速时,他却出于哲学教条坚持是绕圆心的匀速运动,因此其精度反而不如托勒密的模型。这也是哥白尼 理论当时不被看好的原因。开普勒在托勒密与哥白尼两者的基础上将偏心圆换成椭圆,成为定论。去除神秘感,才算接近真相。现在看来开普勒也并非那么神奇,而是承继古希腊罗马集大成的高精度数学模型以及哥白尼的新视点进行的完善。
托勒密(公元100-170)《ALMAGEST》成书大约于公元150年。综观其巨作,里面引用的天文资料早至公元前700多年的巴比伦观测数据,书中旁征博引前人的理论分析,内含大量数学证明与计算。这本数百页的书用希腊语写作,其希腊语版本一直被东罗马保存,而后被翻译成叙利亚语与阿拉伯语。哥白尼之前,西方学者对该书又进行了更为详细的注解,并发现模型中大圆、小圆可以互换,这才导致哥白尼发现托勒密附轮是地球轨道的奥秘。到今天,西方学者还能参考各种语言的版本,对托勒密书中的数据与计算重新核对(只发现很少的错误)。西方这种系统科学知识的承传令人赞叹。与托勒密几乎同期,中国东汉也出现了天文理论家张衡(字平子)(78年-139年)。张衡提出了浑天说,在一篇短文中浅显地比喻说【天如鸡子,地如鸡中黄...周天三百六十五度四分度之一】。张衡还制作了浑天仪,据正史记载(《晋书-天文志》)能够从仪器的转动准确预测星空。但其关于浑天仪的原理只在《后汉书-律历志》一个注解中留下短短几段话,后人拿着浑天仪因为没有说明书竟然不知道怎么使用。其另外一篇《灵宪》也只当成四六句子骈文而被收录,其科学著述基本失传,张衡的实际成就也就无从考证。中国历史上重文轻理的弊端可见一斑。
明朝末年,托勒密理论在徐光启主持下从西方传教士引进中国并编入明《崇祯历书》(注一)。期间,中西天文方法进行了八次计算与观测对比的较量,均轮(deferent)、本轮(epicycle)之精妙令人耳目一新也不得不服(参:《明史-历志》)。勤勉的崇祯皇帝接受了托勒密理论。但明朝旋即覆亡。西方科学承继欧几里得、托勒密,经哥白尼、开普勒,这才有牛顿力学以及之后迅速的科技发展。满清慈禧太后垂帘之际,麦克斯维尔写下电磁理论的微分方程... 西方科学界又发现水星轨道有一个微小的差异不能与牛顿理论吻合,最终是爱因斯坦给出了满意的解答...
这些,都是历史了。
注一:崇祯历书沿袭了托勒密使用的乘除很难操作的60进制,而不是转换成更为方便的十进制,可见基本只是翻译原著,而不是有机吸收。
附图:
# -*- coding: utf-8 -*-
"""
Created on Mon Jun 22 2018
@author: YDX
"""
import matplotlib as mpl
#mpl.use('Agg')
import matplotlib.pyplot as plt
import matplotlib.lines as mlines
from matplotlib import animation
import numpy as np
plt.clf()
mpl.rcParams['animation.ffmpeg_path'] = "C:/Program Files/ImageMagick-7.0.8-Q16/ffmpeg.exe"
mpl.rcParams['animation.convert_path'] = "C:/Program Files/ImageMagick-7.0.8-Q16/magick.exe"
mpl.rc('font', family='Sans-Serif')
bodies ={
'Mars': {'r': 141/93, 'period':687./365, 'phi0':0, 'e':0.093,'plot':{'color':'r'}},
#'Venus': {'r': 67/93, 'o': 365/225, 'phi0':0, 'e':0.007,'plot':{'color':'m'}},
}
def RK4(f):
return lambda t, y, dt: (
lambda dy1: (
lambda dy2: (
lambda dy3: (
lambda dy4: (dy1 + 2*dy2 + 2*dy3 + dy4)/6
)( dt * f( t + dt , y + dy3 ) )
)( dt * f( t + dt/2, y + dy2/2 ) )
)( dt * f( t + dt/2, y + dy1/2 ) )
)( dt * f( t , y ) )
years =1.1
# d\theta/dt = K*[(1+ e cos(theta)) /(1-e^2)]^2
def kepler_v(period,e):
return lambda t, theta: 2*np.pi/period*np.sqrt(1-e*e)*((1+e*np.cos(theta))/(1-e*e))**2
def kepler_point(r,e,theta,xoff=0,yoff=0):
c = np.cos(theta)
rs = r*(1-e*e)/(1+e*c)
x = rs*c+xoff
y= rs*np.sin(theta)+yoff
return (x, y)
#theta is the angle at the equant (-e,0)
def ptolemy_point(r,e, theta, xoff=0, yoff=0):
c = np.cos(theta)
s = np.sin(theta)
sx = e * s
cx = np.sqrt(1-sx*sx)
rr = r*(e*c + cx)
x = rr*c-2*r*e+xoff
y= rr *s+yoff
return (x,y)
def kepler_seq (period, r, e, revolutions, tstep):
kv = kepler_v(period, e)
kvr4 = RK4(kv)
n = int(revolutions*2*np.pi/tstep)+1
th=0
i=0
t=0
xarr=np.empty([n,])
yarr=np.empty([n,])
xarr[0]=r*(1-e)
yarr[0]=0
while i < n-1:
i = i+1
t=t+tstep
th = th + kvr4(t, th,tstep)
x,y = kepler_point(r,e,th)
xarr[i]=x
yarr[i]=y
return (xarr, yarr)
def ptolemy_seq (period, r, e, revolutions, tstep):
omega = 2*np.pi/period
angles =np.arange(0,2*np.pi*revolutions,tstep) *omega
return ptolemy_point(r, e, angles, 0)
plt.gcf().set_size_inches(8,8)
frames =600
tstep =0.005
posk ={}
posp={}
linek = {}
linep={}
linea={}
lineb={}
linec={}
txt = None
n = int(years*2*np.pi/tstep)
ax = plt.subplot(111)
ax.set_aspect('equal')
fig = plt.gcf()
for b in bodies.keys():
r, period, e = [bodies[b][x] for x in ['r','period','e']]
ax.set_xlim(-r*(1+e)-0.2,r*(1-e)+0.2)
ax.set_ylim(-r-0.1,r+0.1)
posk[b] = kepler_seq(period, r, e, years, tstep)
posp[b]= ptolemy_seq(period, r, e, years, tstep)
xoff = 2*e*r
angle_k = np.arctan2(posk[b][1], posk[b][0] )
angle_p = np.arctan2(posp[b][1], posp[b][0] +xoff)
angle_kp = np.arctan2(posk[b][1], posk[b][0]+xoff)
angle_delta = angle_kp - angle_p
ax.plot([-r*e], [0], marker='o', color='b')
ax.plot([-2*r*e], [0], marker='o', color='g')
ax.annotate('EQT', xy=(-2*r*e,0), xytext=(-2*e*r-0.1, -0.1))
linek[b], =ax.plot(posk[b][0][0],posk[b][1][0], **bodies[b]['plot'], ls='-', markersize=3)
linea[b] = mlines.Line2D([0,posk[b][0][0]],[0, posk[b][1][0]], color='r')
ax.add_line(linea[b])
linep[b], =ax.plot(posp[b][0][0],posp[b][1][0], color="b", ls='-', markersize=3)
lineb[b] = mlines.Line2D([0,posp[b][0][0]],[0, posp[b][1][0]], color='b')
ax.add_line(lineb[b])
linec[b] = mlines.Line2D([-2*r*e,posp[b][0][0]],[0, posp[b][1][0]], color='b',linestyle='dashed',lw=1)
ax.add_line(linec[b])
txt = ax.text(0, -1, "")
#fig2, ax2= plt.subplots()
#ax2.plot(angle_k, angle_delta)
ax.plot([0], [0], marker='o', color='y',markersize=13)
ax.set_title("Ptolemy v. Kepler (e="+str(e)+")")
ax.relim()
ax.autoscale_view(True,True,True)
def init():
return list( [lineX[x] for lineX in [linea, lineb, linec, linek, linep] for x in linek.keys()])+ [txt]
def update(i):
ax.autoscale_view(True,True,True)
for b in bodies.keys():
r, period, e = [bodies[b][x] for x in ['r','period','e']]
n2 = int(n*i/frames)
n1 = 0
if(n2>1200):
n1= n2-1200
#print (i, frames, n, n2)
linea[b].set_data([0,posk[b][0][n2]],[0, posk[b][1][n2]])
lineb[b].set_data([0,posp[b][0][n2]],[0, posp[b][1][n2]])
angles = np.arctan2([posk[b][1][n2], posp[b][1][n2]], [posk[b][0][n2], posp[b][0][n2]])
xoff = 2*e*r
angles2 = np.arctan2([posk[b][1][n2], posp[b][1][n2]], [posk[b][0][n2]+xoff, posp[b][0][n2]+xoff])
delta = (angles[1]-angles[0])*180/np.pi
delta2 = (angles2[1]-angles2[0])*180/np.pi
print ("angle=", angles, delta, angles2, delta2)
txtstr = '$\Delta=%.2f^\circ$' % (delta)
txt.set_text(txtstr)
linec[b].set_data([-2*e*r,posp[b][0][n2]],[0, posp[b][1][n2]])
linek[b].set_data(posk[b][0][n1:n2],posk[b][1][n1:n2])
linep[b].set_data(posp[b][0][n1:n2],posp[b][1][n1:n2])
return list( [lineX[x] for lineX in [linea, lineb, linec, linek, linep] for x in linek.keys()])+ [txt]
animate = animation.FuncAnimation(plt.gcf(), update, init_func=init, frames=frames, interval=100, blit=True)
#animate.save("c:/tmp/kepler-ptolemy-compare"+str(e)+".gif",writer='imagemagick', savefig_kwargs =dict(pad_inches=0))
#animate.save("c:/tmp/kepler-ptolemy-compare"+str(e)+".mp4",writer='ffmpeg', savefig_kwargs =dict(pad_inches=0))
plt.show()